Information Processing | Term 1 Chapter 6 | 5th Maths - Exercise 6.3 (Bar graph or chart) | 5th Maths : Term 1 Unit 6 : Information Processing
Chapter: 5th Maths : Term 1 Unit 6 : Information Processing
Exercise 6.3 (Bar graph or chart)
Bar graph
Exercise 6.3
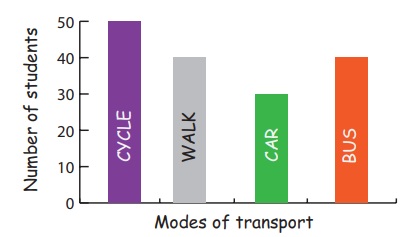
1. The bar chart
represents the number of students using different modes of transport. Answer
the following questions.
Questions
1
Which mode of transport is mostly used by the students? Cycle
2
How many students come to school by walking? 40
3
Which mode of transport is used the least? Car
4
How many students come by Bus? 40
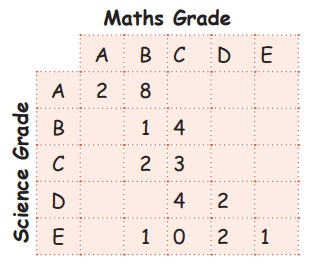
2. The following
information shows the grades in science and maths of 30 students.
Questions
1
How many students got same grades in both the subjects? 9
2
How many students got a higher grade in science than in maths? 8
3 Which was the most common grade in science? B
3.
Mr. Dinesh collected information about the rainfall of a particular city in a
week from the newspaper and recorded his information in the pictograph.
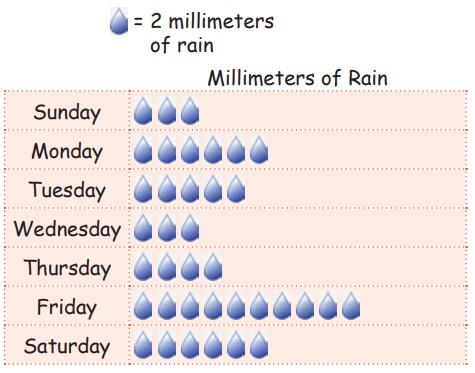
1 On which day, the rain was the most? Friday
2
On which day, the rain was the least? Sunday and Wednesday
3
How much rain was there on Sunday? 6 millimeters
4
How much rain was there on Monday? 12 millimeters
5
Find the total rainfall of the city in that week? 74 millimeters
4.
Neela, Mala, Kala and Bala were neighbours. The following data shows the number
of fish in their fish tank respectively. Draw a pictograph to represent the
data and answer the questions.
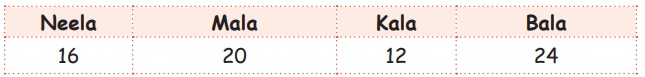
1. How may fish did bala have? 24
2. Who has 16 fish? Neela
3. How many fewer fish did Kala have
than Mala? 8
4. How many fish did Neela and Bala have
together? 40
Related Topics