Information Processing | Term 1 Chapter 6 | 5th Maths - Exercise 6.2 (Pictograph) | 5th Maths : Term 1 Unit 6 : Information Processing
Chapter: 5th Maths : Term 1 Unit 6 : Information Processing
Exercise 6.2 (Pictograph)
Exercise 6.2
1.
The following table shows the weight of paddy Cultivated in a particular
village between 2010 and 2015
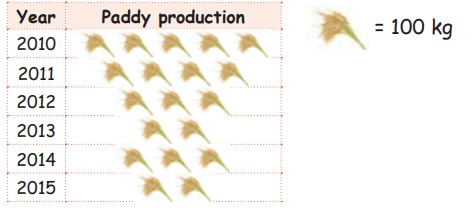
Observe
the pictograph and answer the following questions.
1. In which year the paddy production
was maximum? 2010
2. In which years the paddy productions
were equal?
2012 and 2014,
2013 and 2015
3. Find the paddy production in 2015. 200 kg
4. Find the total quantity of paddy
production in 2013, 2014, and 2015. 700kg
2.
The total number of pupils studying in class 5 are as follows
GHSS: 1000
PUPS: 200
BHSS: 400
PUMS: 400
Private nursery School : 800
Prepare
a pictograph using the symbol ![]() to represent 100 Pupils and answer
the following question:
to represent 100 Pupils and answer
the following question:
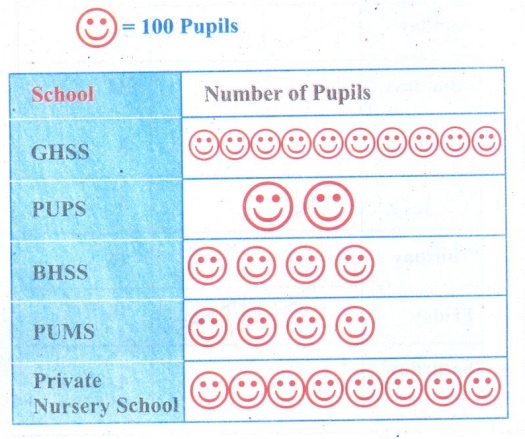
1.
Which school has the maximum number of pupils?
1. GHSS has the maximum number of pupils.
2.
Which school has the least number of pupils?
2. PUPS has the least number of pupils.
Related Topics