Information Processing | Term 1 Chapter 6 | 4th Maths - Exercise 6.2 (Collect and represent data in the form of bar graphs) | 4th Maths : Term 1 Unit 6 : Information Processing
Chapter: 4th Maths : Term 1 Unit 6 : Information Processing
Exercise 6.2 (Collect and represent data in the form of bar graphs)
Text Book Back Exercises Questions with Answers, Solution : 4th Maths : Term 1 Unit 6 : Information Processing : Exercise 6.2 (Collect and represent data in the form of bar graphs)
Exercise 6.2
1. Bar
diagram of a student’s first term scores are given.
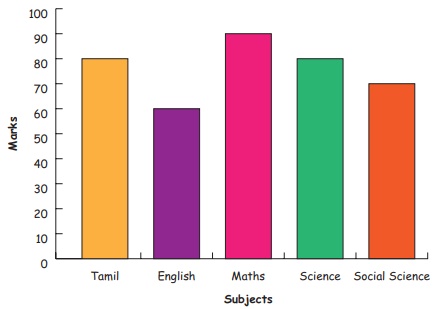
a. Which
subject is the highest score in “A” ?
Maths
b. Which
subject is the lowest score in “A” ?
English
c. Which
subject is the same score in “A” ?
Tamil and Science
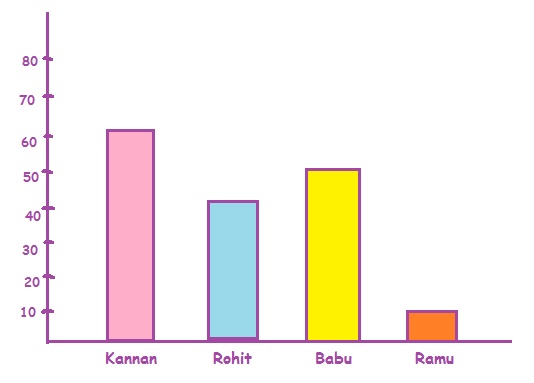
2. The
score card of the players in a cricket match is given.
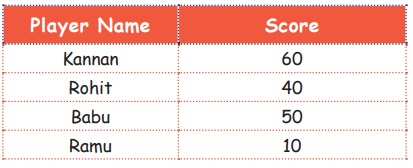
Draw a Bar diagram.
Tags : Information Processing | Term 1 Chapter 6 | 4th Maths , 4th Maths : Term 1 Unit 6 : Information Processing
Study Material, Lecturing Notes, Assignment, Reference, Wiki description explanation, brief detail
4th Maths : Term 1 Unit 6 : Information Processing : Exercise 6.2 (Collect and represent data in the form of bar graphs) | Information Processing | Term 1 Chapter 6 | 4th Maths
Related Topics
4th Maths : Term 1 Unit 6 : Information Processing