Information Processing | Term 1 Chapter 6 | 3rd Maths - Drawing Conclusion from the Represented Data | 3rd Maths : Term 1 Unit 6 : Information Processing
Chapter: 3rd Maths : Term 1 Unit 6 : Information Processing
Drawing Conclusion from the Represented Data
Drawing Conclusion from
the Represented Data
Activity 4
Draw a conclusion from
the representation by discussing with your teacher.
The graph below shows the number of
children in a school studying in classes 1−4 of a school. The number of girls
studying in classes 1−4 of a school are 14, 10, 16 and 13 respectively. Draw
the graph discussing with your teacher for number of boys studying in classes 1−4.
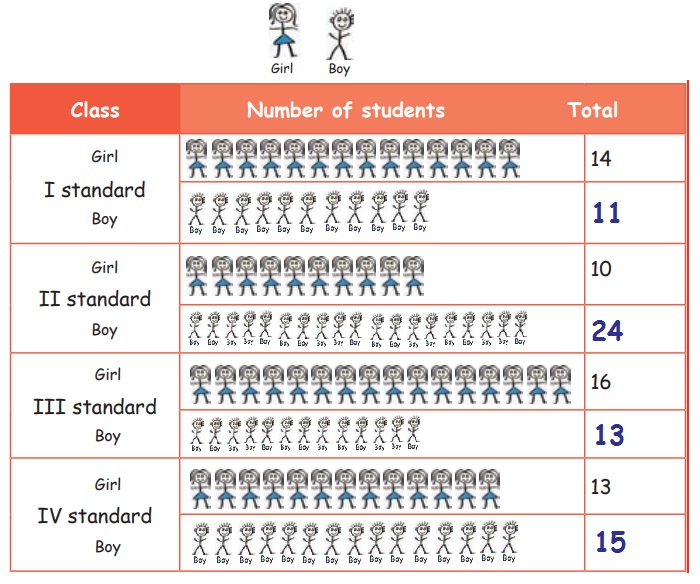
After completing the pictorial
representation answer the following questions.
1. The number of girls in class 2 is 10.
2. The number of boys in class 3 is 13.
3. The total number of students in class
4 is 28.
4. The total number of girls from class
1to 4 is 53.
5. The total number of boys from class 1
to 4 is 63.
6. The class which has more strength is II.
Teacher’s note : Teacher can help the
children to collect the number of boys in each class and complete the pictorial
representation.
Related Topics